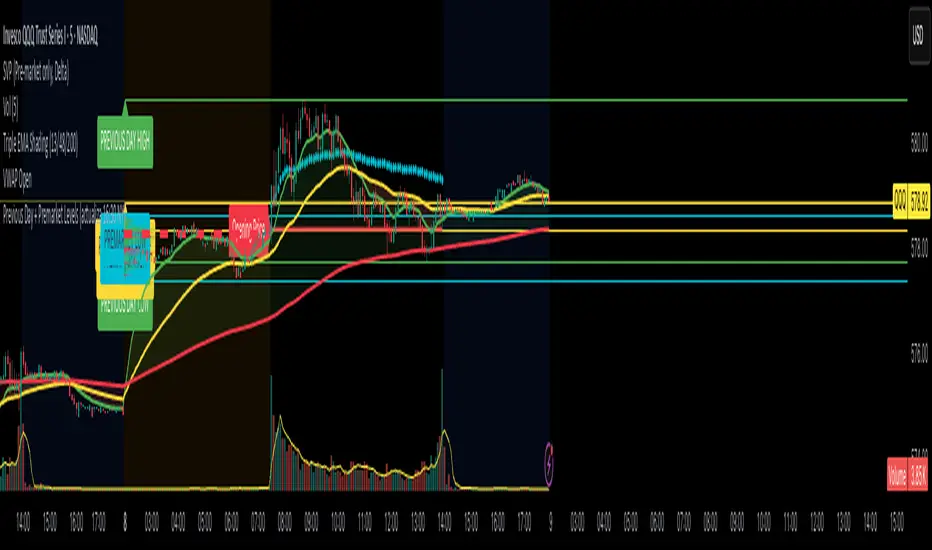
Previous High/Low LevelsPrevious High/Low Levels
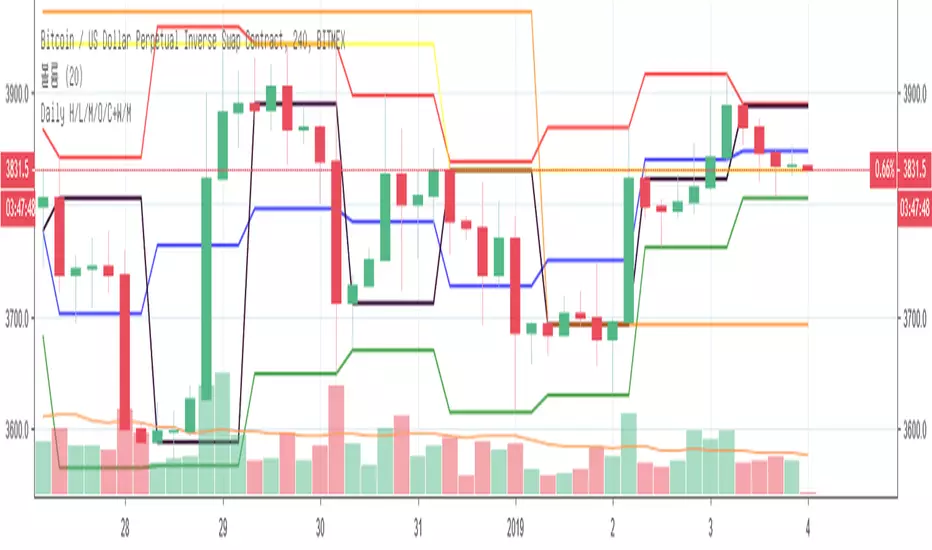
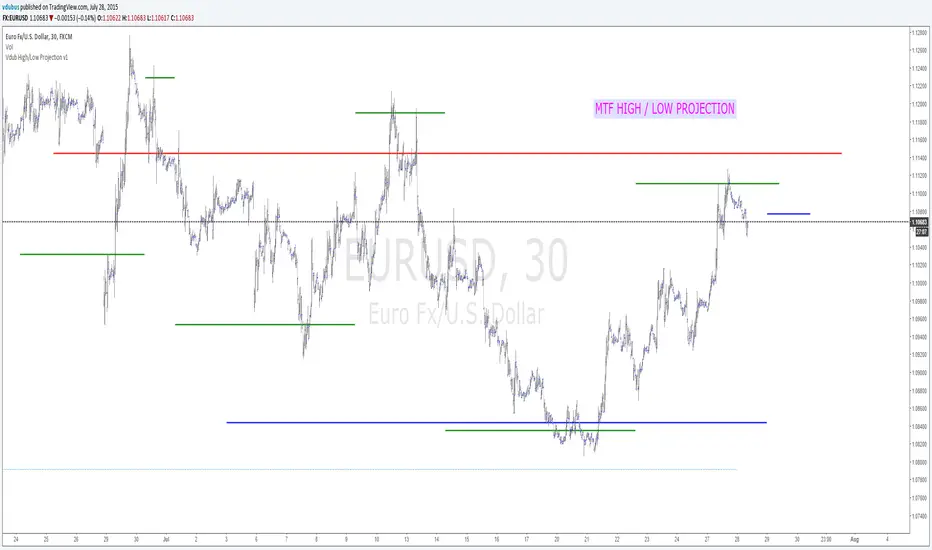
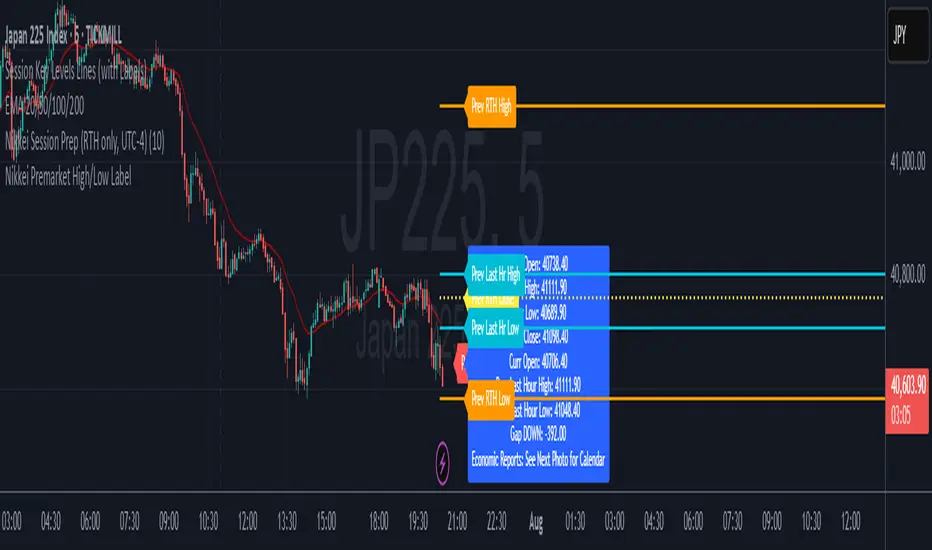
Select 5 Custom Timeframes to display the previous High and Low levels on your chart.
NOTE: For Levels to work correctly and for price labels to be displayed, Right-click chart background -> select Settings -> select Scales -> tick “Indicator Last Value Label".
Once indicator has been added open settings and select timeframe, color, labels, offset parameters and line style as desired then SAVE.
Handy when using The Strat.
Pine Script® göstergesi